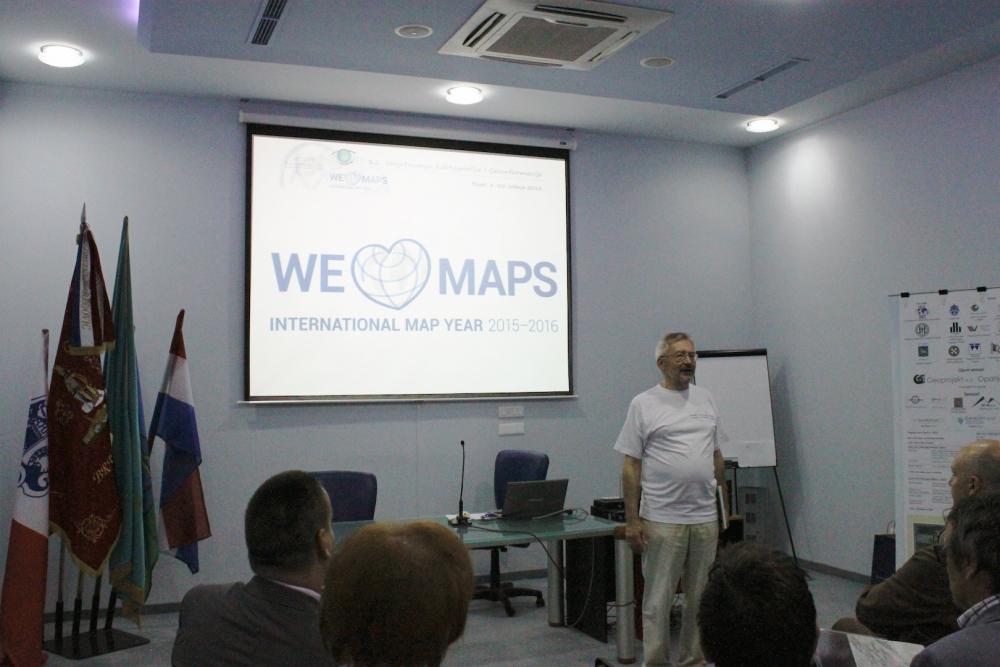
11th Conference “Cartography and Geoinformation”, organized by Croatian Cartographic Society was held in Buzet, Croatia from May 8-10, 2015. By organizing the conference in the International Map Year (IMY), the Croatian Cartographic Society had a wish to contribute to the development of geoinformatics, cartography, geography and associated fields.
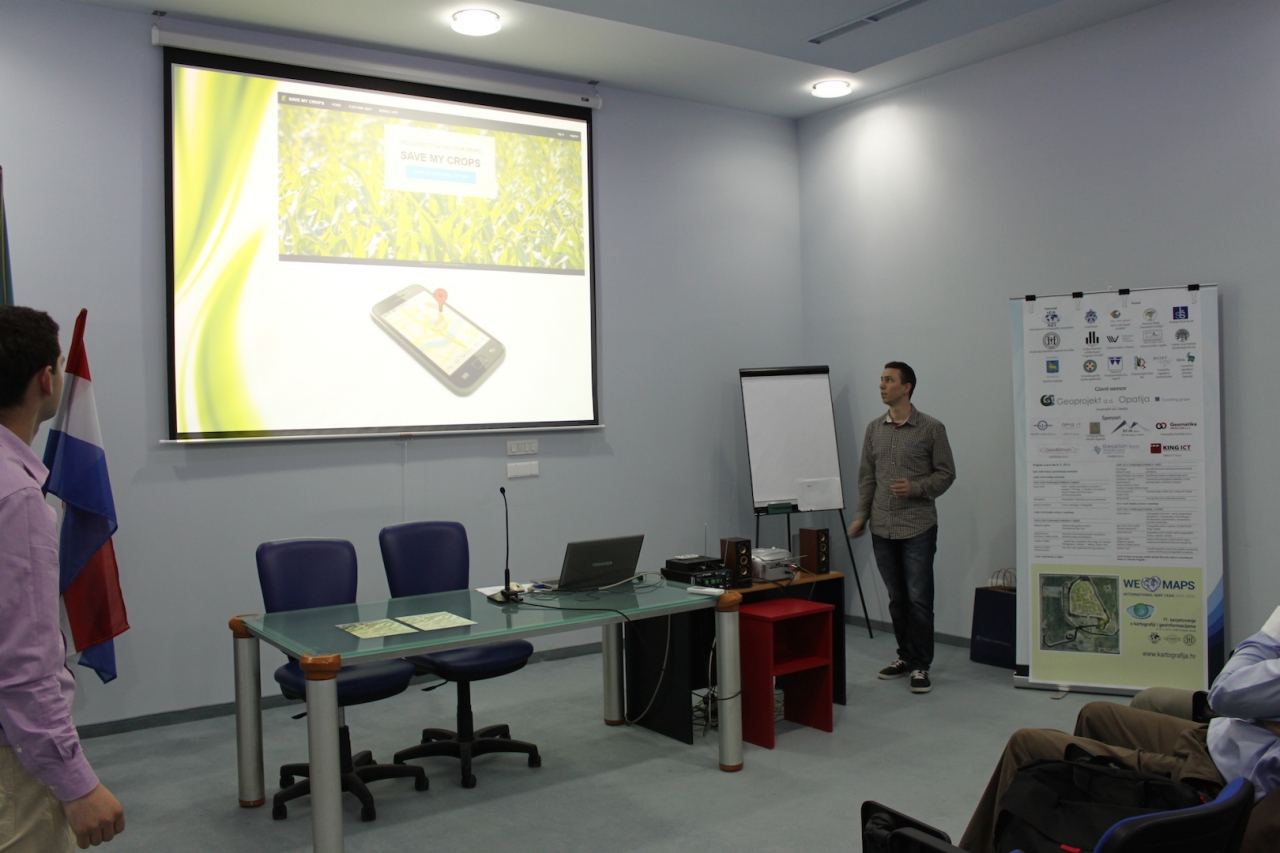
Amphinicy visited the conference and one of it's employees, Mauricio Vidulin, held a presentation on Save My Crops application with his colleague Marko Polovina.
First day of the conference was reserved for many interesting presentations, and on the second day visitors had a chance to learn how images are acquired using a UAV, as well as how to process them. Additionaly, everyone was invited to compete in the Sprint Orienteering race. On the third day, visitors had a chance to participate in organized trip across the beautiful peninsula of Istrian region.
In the following text, I mentioned some of the most noticeable presentations held at the conference. First presentation was held by professor dr. sc. Josip Faričić, and he talked about space in general and about maps as a medium of communication in space. Throughout his presentation he showed, in quite appealing manner, how maps can be used to describe real or virtual (imaginary) space and how different kind of maps can be used to deliver various kind of information to its users.
The second presentation, titled “Spatial Data Acquistion from Maps for Disaster Management Analysis – Balkan Floods 2014” was held by Franka Grubišić. In scope of the presentation, she talked about using geospatial data and imagery derived from satellite and LiDAR systems in analyzing flood risks. Franka also highlighted the usage of ESA Copernicus satellite imagery in analysing the areas affected by floods in the Balkan in 2014.
Valentina Vuković held a presentation in which she talked about her experiments with collecting field data by volunteers and using it for monitoring city noise in real-time. She explained how she had processed the data and also presented us with the resulting noise heatmaps.
Dora Zenzerović talked about how she had processed 2011 Census data of Croatia and created a thematic interactive online map to visually present the data to the broader public. She stressed that batch of data stored in tables means almost nothing to most people because it is hard to understand. However, data visualised through thematic maps makes a lot more sense to the public and to people in state and city offices.
In the last presentation of the day, dr. sc. Dražen Tutić presented us with his open source QGIS plugin application for visualisation and analysis of the map projection deformations, after which he explained the core concepts behind it.
All the presentations raised a lot of questions and opened a lot of subjects, so breaks between presentations were maximally used for networking, exchanging contacts and sharing interestings emprical stories.
It is exciting to see that geoinformation technology is spreading through growing number of applications and that there are a lot of people eager to use it to create new values and modern products.
